Politics often involves a lot of spin. Even seemingly straightforward numbers can be manipulated and distorted.
As a result, the impressive economic statistics touted by candidates often come with many asterisks, caveats, and “yes, buts.”
In this election cycle, these qualifiers have increased due to peculiarities in the data: a rare pandemic and a significant inflation event that disrupted the economy, distorting economic data and presidential records.
“Interpreting economic data is like interpreting a Monet painting in the best of times,” Mark Zandi, chief economist at Moody’s Analytics, told CNN. “But in these times, it’s a Monet painting with the Picasso overlaid on top of it. Very difficult to interpret.”
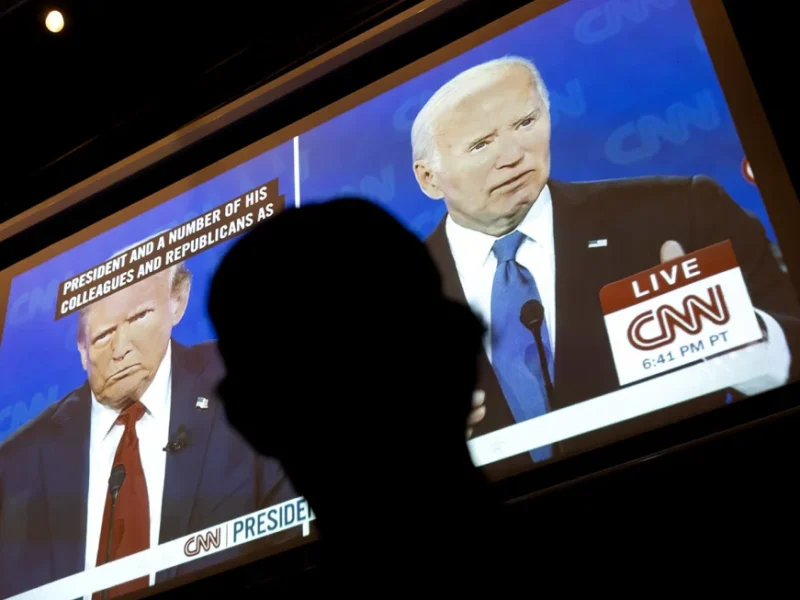
During Thursday night’s presidential debate between President Joe Biden and former President Donald Trump, these complexities were evident as they debated the economy.
“Trump blamed Biden for inflation; that’s misplaced because I don’t think either of them were to blame — the pandemic and Russian war were to blame,” Zandi said. “When President Biden takes credit for all jobs and says Trump lost all the jobs? That’s not fair either, because the pandemic really scrambled things.”
“I don’t think either candidate is on very strong ground by looking at history to discern whether their policies are good or bad. You’d have to use different criteria,” he added.
“Not yet stable”
Economists, analysts, and business journalists attempt to extract segments of data to improve comparisons. For instance, Zandi has analyzed the economies under Trump in 2019 and Biden in 2023. However, traditional metrics may not currently provide a complete picture, as ongoing shocks continue to influence the system.
Joe Brusuelas, principal and chief economist at RSM US, explained to CNN that the economy has not yet stabilized into a consistent equilibrium post-pandemic. He emphasized that until this happens, understanding the new metrics reflecting economic direction and consumer confidence remains elusive.
Brusuelas noted that presidential elections used to hinge on straightforward factors like jobs. Today, however, they are more intricate, influenced by cultural affiliations and identities, complicating economic interpretation. Even reliable indicators, such as high labor participation rates among prime-age women, once used to predict election outcomes, now face uncertainty due to changing economic dynamics.
He highlighted that while the labor participation rate among women aged 25 to 54 hit a record high in May, this increase might be driven by the aftermath of price shocks and women returning to work to offset income losses elsewhere. Brusuelas concluded that numerous other metrics, once reliable predictors, now struggle to forecast election results due to the evolving economy and societal shifts.
Protein and petrol
Consider the S&P 500, which has been thriving, driven by Nvidia’s success and the excitement surrounding artificial intelligence. However, when you look at it from an individual’s perspective, the situation changes.
“People might think, ‘All this investment in AI could replace jobs like mine? I don’t care if the unemployment rate is low. My job is still at risk,'” he explained.
For most people, economic data has limited relevance, Brusuelas noted, emphasizing that it boils down to basic essentials like food (protein) and fuel (petrol), rather than just statistical figures.
“When it comes to the average American household, they understand the economy through the cost of groceries and gas—things they encounter every week,” he said.


